Gallery
This gallery shows most of the geometries and operations that can be constructed using geoparticle.
Source code
1import numpy as np
2import geoparticle as gp
3import matplotlib.pyplot as plt
4from warnings import filterwarnings
5
6filterwarnings('ignore', message='.*quantized.*')
7
8dl = 0.2
9# 1D gallery ====================
10fig0 = plt.figure(figsize=(12, 6))
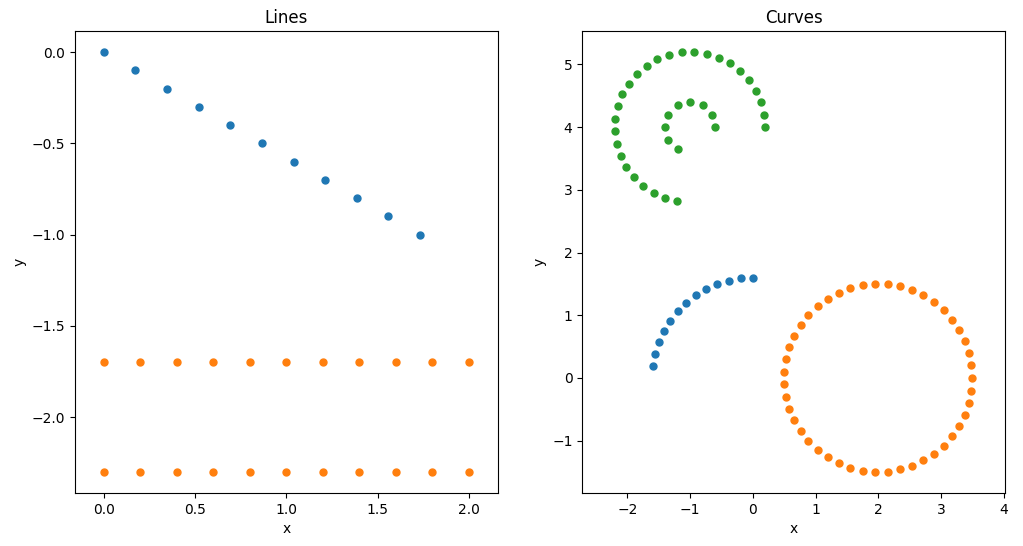
11# line
12ax01 = fig0.add_subplot(121)
13line = gp.Line(2, 'x', dl, name='line').rotate(-30, 'z')
14line.plot(ax01)
15
16symm_lines = gp.SymmLines(2, 'x', 'XOZ', 0.3, dl, name='symm_lines').shift(y=-2)
17symm_lines.plot(ax01)
18
19ax01.set_title('Lines')
20ax01.axis('equal')
21
22# curves
23ax02 = fig0.add_subplot(122)
24arc = gp.Arc(1.6, '[90, 180)', dl, name='arc')
25arc.plot(ax02)
26
27circle = gp.Circle(1.5, dl, name='circle').shift(x=2)
28circle.plot(ax02)
29
30conc_arc = gp.ConcentricArc(1.2, 0.6, dl, plane='XOY', phi_range='[0,270)',
31 name='conc_arc').shift(x=-1, y=4)
32conc_arc.plot(ax02)
33
34ax02.set_title('Curves')
35ax02.axis('equal')
36
37# 2D gallery ====================
38fig1 = plt.figure(figsize=(12, 6))
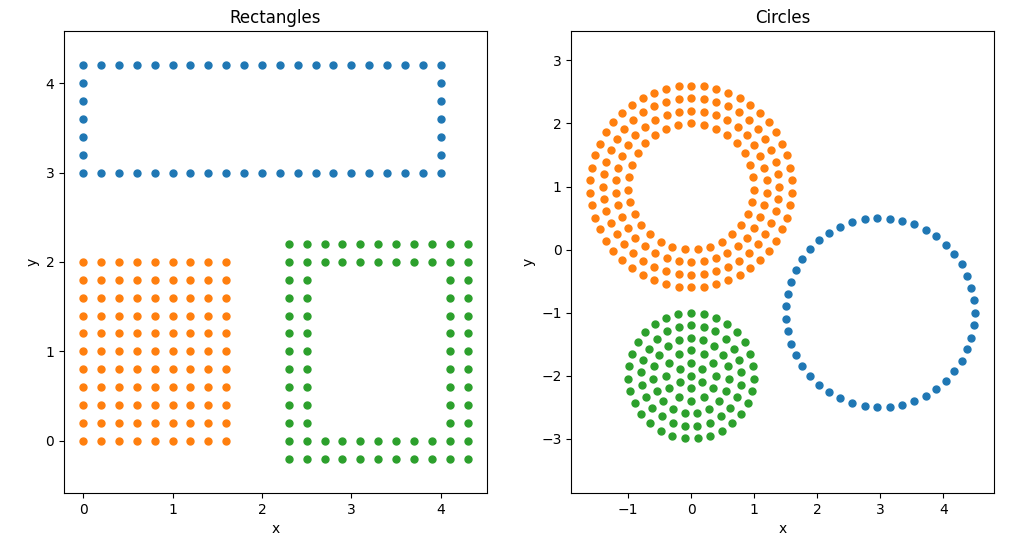
39ax11 = fig1.add_subplot(121)
40# rectangles
41rectangle = gp.Rectangle(4, 1.2, dl, name='rect').shift(y=3)
42rectangle.plot(ax11)
43filled_rectangle = gp.FilledRectangle(1.7, 2, dl)
44filled_rectangle.plot(ax11)
45thick_rectangle = gp.ThickRectangle(1.7, 2, 2, dl).shift(x=2.5)
46thick_rectangle.plot(ax11)
47ax11.set_title('Rectangles')
48ax11.axis('equal')
49# circles
50ax12 = fig1.add_subplot(122)
51circle = gp.Circle(1.5, dl, name='circle').shift(x=3, y=-1)
52circle.plot(ax12)
53
54thick_ring = gp.ThickRing(1.6, 1, dl).shift(y=1)
55thick_ring.plot(ax12)
56
57filled_circle = gp.FilledCircle(1, dl).shift(y=-2)
58filled_circle.plot(ax12)
59
60ax12.set_title('Circles')
61ax12.axis('equal')
62
63# 3D gallery ====================
64fig2 = plt.figure(figsize=(10, 10))
65dl = 0.4
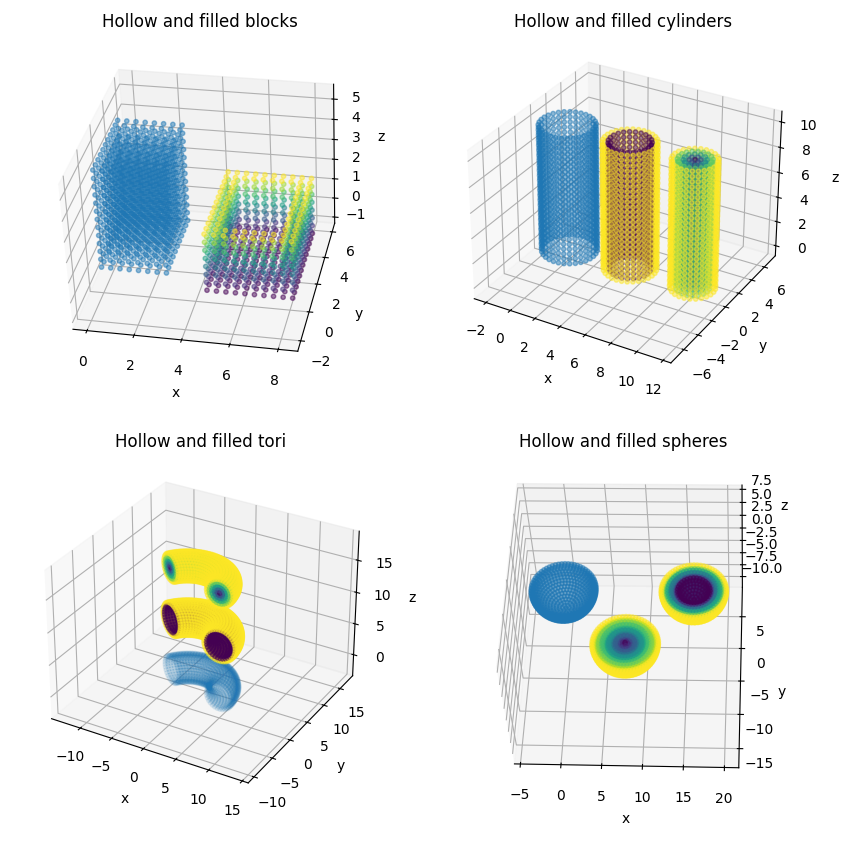
66# block
67ax21 = fig2.add_subplot(221, projection='3d')
68block = gp.Block(3, 4, 5, dl)
69thick_block_wall = gp.ThickBlockWall(3, 4, 5, 2, dl).shift(x=5)
70clipped_wall = gp.Clip(thick_block_wall, keep='negative', plane_point=(6.5, 2, 2.5), plane_normal=(0, 0, 1))
71ax21 = block.plot(ax21)
72ax21 = clipped_wall.plot(ax21, c=clipped_wall.zs)
73ax21.set_title('Hollow and filled blocks')
74ax21.view_init(elev=33, azim=-76, roll=3)
75# tube
76ax22 = fig2.add_subplot(222, projection='3d')
77tube = gp.CylinderSide(2, 10, dl, 'z')
78thick_tube = gp.ThickCylinderSide(2, 1.5, 10, dl, 'z').shift(x=5)
79water_column = gp.FilledCylinder(1.8, 10, dl, 'z', name='column', anchor=(10, 0, 0))
80tube.plot(ax22)
81thick_tube.plot(ax22, c=thick_tube.radius)
82water_column.plot(ax22, c=water_column.radius)
83ax22.set_title('Hollow and filled cylinders')
84
85# torus
86ax23 = fig2.add_subplot(223, projection='3d')
87torus_surface = gp.TorusSurface(2, 5, dl, plane='XOY', phi_range='[0,150)')
88thick_torus = gp.ThickTorusWall(2, 5, 2, dl, plane='XOY', phi_range='[0,150)').shift(z=8)
89filled_torus = gp.FilledTorus(2, 5, dl, plane='XOY', phi_range='[0,150)').shift(z=16)
90torus_surface.plot(ax23, alpha=0.1)
91thick_torus.plot(ax23, c=thick_torus.radius)
92filled_torus.plot(ax23, c=filled_torus.radius)
93ax23.set_title('Hollow and filled tori')
94# sphere
95ax24 = fig2.add_subplot(224, projection='3d')
96sphere_surface = gp.Clip(gp.SphereSurface(4, dl, 'sphere_surface'), keep='negative',
97 plane_point=(0, 0, 0), plane_normal=(0, 0, 1))
98sphere_shell = gp.Clip(gp.ThickSphere(4, 2, dl), keep='negative',
99 plane_point=(0, 0, 0), plane_normal=(0, 0, 1))
100sphere = gp.Clip(gp.FilledSphere(4, dl, 'sphere'), keep='negative',
101 plane_point=(0, 0, 0), plane_normal=(0, 0, 1))
102
103
104def calc_rs(coords):
105 return np.sqrt((coords ** 2).sum(axis=1))
106
107
108sphere_surface.plot(ax24)
109sphere_shell.shift(x=16).plot(ax24, c=calc_rs(sphere_shell.matrix_coords))
110sphere.shift(x=8, y=-8).plot(ax24, c=calc_rs(sphere.matrix_coords))
111ax24.view_init(elev=54, azim=-83, roll=5)
112ax24.set_title('Hollow and filled spheres')
113for ax in (ax21, ax22, ax23, ax24):
114 ax.set_xlabel('x')
115 ax.set_ylabel('y')
116 ax.set_zlabel('z')
117 ax.axis('equal')
118
119# Transformation
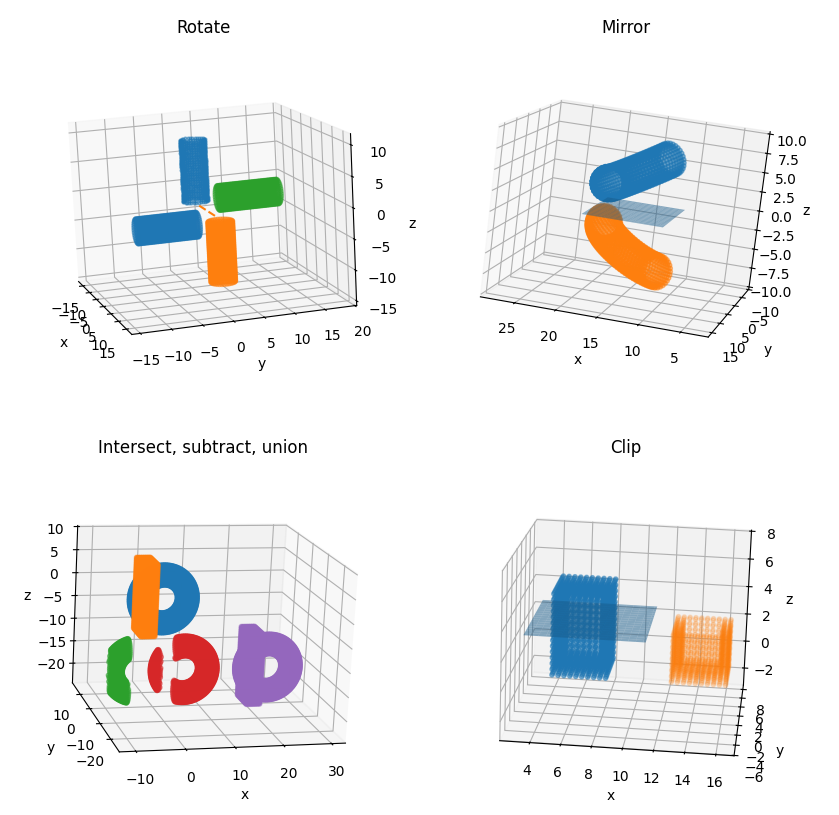
120fig3 = plt.figure(figsize=(10, 10))
121# rotate
122ax31 = fig3.add_subplot(221, projection='3d')
123ax31.plot(tube.xs, tube.ys, tube.zs, 'o', alpha=0.5, ms=2)
124for i in range(3):
125 tube_rot = tube.rotate(90 * (i + 1), 'x', (0, 2, -2))
126 tube_rot.plot(ax31)
127ax31.plot([-5, 5], [2, 2], [-2, -2], '--')
128ax31.view_init(elev=12, azim=-16, roll=3)
129ax31.set_title('Rotate')
130# mirror
131ax32 = fig3.add_subplot(222, projection='3d')
132x_plane = np.linspace(10, 20)
133y_plane = np.linspace(-3, 10)
134X_plane, Y_plane = np.meshgrid(x_plane, y_plane)
135Z_plane = np.full_like(X_plane, 0)
136ax32.plot_surface(X_plane, Y_plane, Z_plane, rstride=3, cstride=3, alpha=0.5)
137torus_surface = torus_surface.rotate(30, 'y').shift(x=15, z=5)
138torus_surface.plot(ax32)
139torus_mirror = torus_surface.mirror('XOY', 0)
140torus_mirror.plot(ax32)
141ax32.view_init(elev=11, azim=102, roll=-7)
142ax32.set_title('Mirror')
143# intersect
144ax33 = fig3.add_subplot(223, projection='3d')
145torus_surface = gp.TorusSurface(2, 5, dl, gp.n_per_ring(2, dl), regular_id=False,
146 plane='XOZ', phi_range='[0,360)').shift(y=-5)
147block = gp.Block(3, 7, 15, dl).shift(x=-5, y=-8, z=-7)
148intersect = gp.Intersect((torus_surface, block), rmax=dl).shift(x=-5, z=-15)
149subtract = gp.Subtract(torus_surface, block, rmax=dl).shift(x=5, z=-15)
150# union = gp.Union((torus_surface, block)).shift(x=23, z=-15)
151union = torus_surface.union(block).shift(x=23, z=-15)
152torus_surface.plot(ax33)
153block.plot(ax33)
154intersect.plot(ax33)
155subtract.plot(ax33)
156union.plot(ax33)
157ax33.view_init(elev=15, azim=-106, roll=-3)
158ax33.set_title('Intersect, subtract, union')
159# clip
160ax34 = fig3.add_subplot(224, projection='3d')
161thick_block_wall.plot(ax34)
162clip = gp.Clip(thick_block_wall, keep='negative', plane_point=(1, 0, 3), plane_normal=(0, 0, 1)).shift(x=8)
163x_plane = np.linspace(3, 11)
164y_plane = np.linspace(-3, 6)
165X_plane, Y_plane = np.meshgrid(x_plane, y_plane)
166Z_plane = np.full_like(X_plane, 3)
167ax34.plot_surface(X_plane, Y_plane, Z_plane, rstride=3, cstride=3, alpha=0.5)
168clip.plot(ax34, alpha=0.2)
169ax34.view_init(elev=16, azim=-85, roll=-2)
170ax34.set_title('Clip')
171
172for ax in (ax31, ax32, ax33, ax34):
173 ax.set_xlabel('x')
174 ax.set_ylabel('y')
175 ax.set_zlabel('z')
176 ax.axis('equal')
177plt.show()